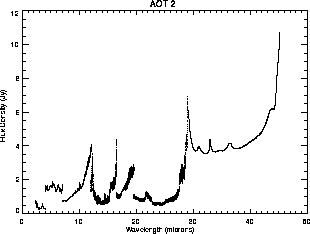
Figure: Sensitivity of AOT SWS02. Flux density vs. wavelength, detectable at SNR = 20 per resolution element in a 2500 second observation.


Table and figures presented in this section are calculated either from data taken during the Performance Verification phase or with the current version of the logic.

Figure: Sensitivity of AOT SWS02. Flux density vs. wavelength,
detectable at SNR = 20 per resolution element in a 2500 second
observation.

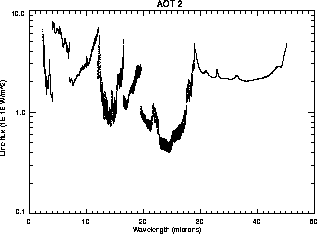
Figure: Sensitivity of AOT SWS02. Line flux vs. wavelength
(line confined within one resolution element), detectable at
SNR = 20, in a 2500 second observation.

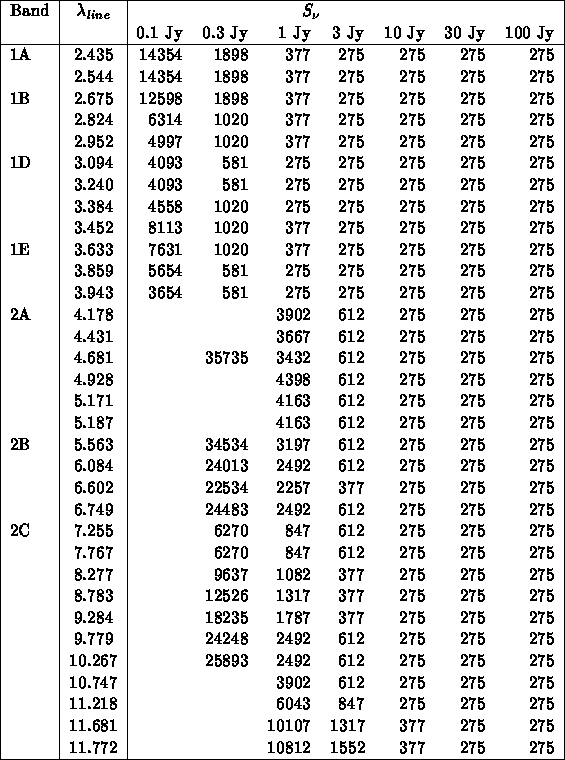
Table: AOT SWS02 observing times for sources of 0.1, 0.3, 1, 3, 10, 30, and
100 Jy. Wavelength intervals correspond to  10 resolution
elements. In all cases SNR = 20 was requested, but may be exceeded.

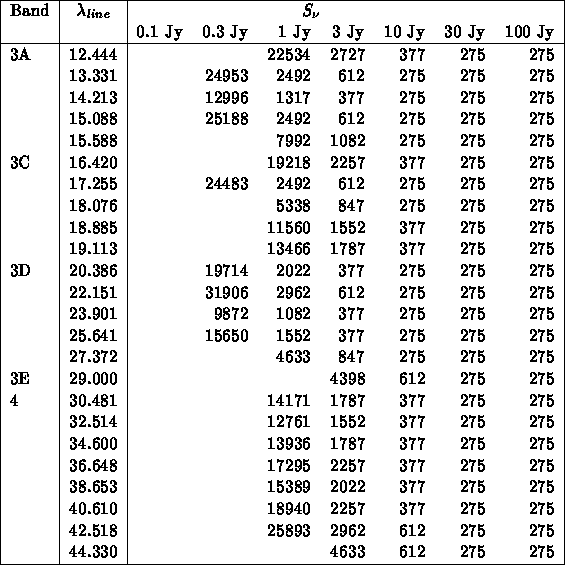
Table: Continuation of AOT SWS02 observing times table.