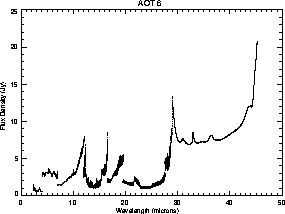
Figure: Sensitivity of AOT SWS06. Spectral flux density vs. wavelength, detectable at SNR = 20 per resolution element. It is assumed that a pure integration time of 120 sec is used for the wavelength range of 30 scanner steps covered by AOT SWS06


Table and figures presented in this section are derived either from data taken during the Performance Verification phase or with the current version of the logic.

Figure: Sensitivity of AOT SWS06. Spectral flux density vs.
wavelength, detectable at SNR = 20 per resolution element. It is
assumed that a pure integration time of 120 sec is used for the wavelength
range of 30 scanner steps covered by AOT SWS06

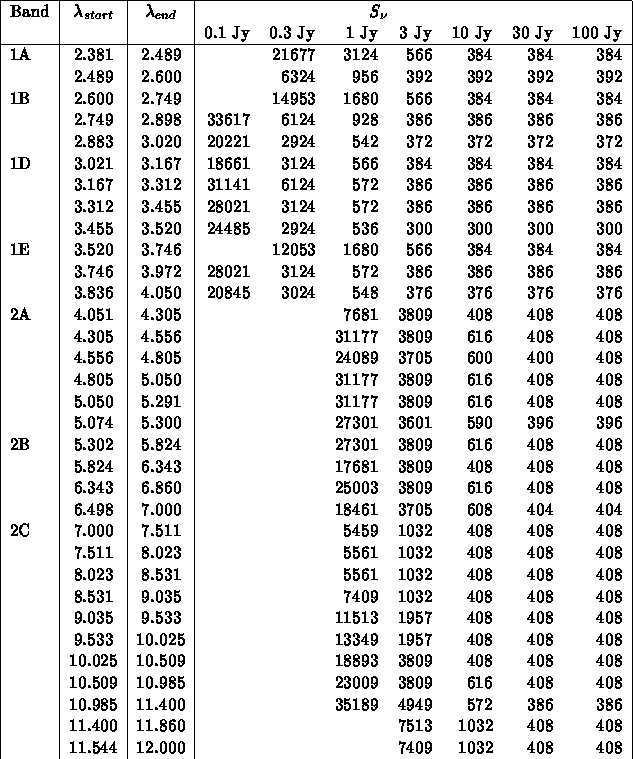
Table: AOT SWS06 grating scan observing times for wavelength intervals
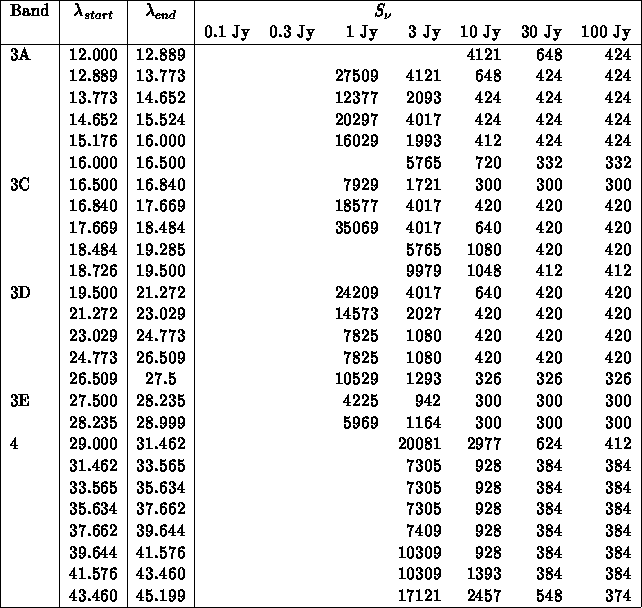
corresponding to  80 resolution elements of sources of 0.3, 1, 3, 10,
30, and 100 Jy. In all cases a SNR = 20 per resolution element
was requested, but may be exceeded.

Table: Continuation of AOT SWS06 grating scan observing times