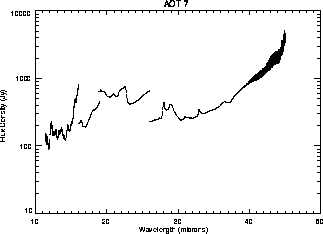
Figure: Sensitivity of AOT SWS07 F-P. Flux levels that can be reached in an observation of approximately 1200 seconds, covering a wavelength range of 50 km/s at a S/N ratio of 10.


The following performance figure was derived with the help of the Proposal Generation Aids software, implementing the procedure described in section 6.4.3.

Figure: Sensitivity of AOT SWS07 F-P. Flux levels that can be reached in an
observation of approximately 1200 seconds, covering a wavelength range of 50
km/s at a S/N ratio of 10.