


AKARI Results
AKARI observes the distant Universe
One of the most important unanswered questions in modern astronomy is how the galaxies evolved to their current form. To approach this problem it is vital to observe galaxies in the ancient era of our Universe, i.e., to observe galaxies that are very very far away. AKARI has carried out one of the most extensive observations ever made in the far-infrared wavelength range testing the ultimate performance of the FIS, and detecting many faint galaxies in the distant Universe.
In order to ensure the best possible results, the target sky area had to be carefully chosen to minimize the contamination from the material inside our own Galaxy that would hinder the sensitivity of the observations. In other words, we looked out through a transparent window of our Galaxy to observe the distant Universe. The other unique point of these observations is the simultaneous observations in four wavelength bands (65, 90, 140 and 160 micrometres). This wavelength information is essential to investigate the radiation mechanisms responsible for the emission of the infrared light from the galaxies and to estimate the distance to the galaxies from the relative brightness of the different wavelengths.
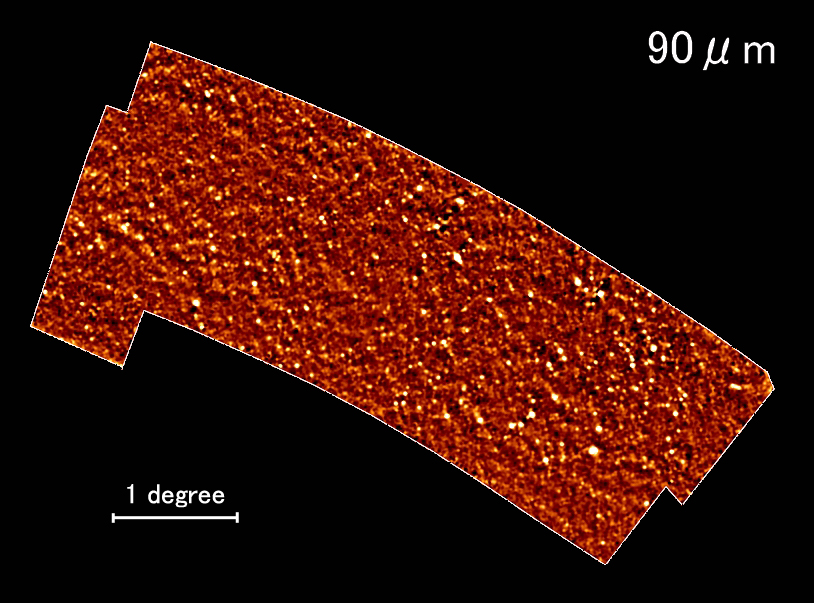
Figure 1 shows the far-infrared Universe through this 'Galactic window'. It is possibly the finest image of the Universe over a huge area of 10 square degrees and is the culmination of around 200 pointed observations with AKARI repeated over 16 months. It looks like sand on a beach but there are large numbers of beautiful shells visible! This particular image is at the wavelength of 90 micrometres. Enlargements of the images obtained in all four wavelength bands are shown in Figure 2.

Figure 1: The distant Universe seen at far-infrared wavelengths (90 micrometres) through the Galactic window near the South Ecliptic Pole in the sky. Many faint galaxies are seen in white over the wide area of 10 square degrees. Observation fields of other deep surveys at other wavelengths are overlaid.
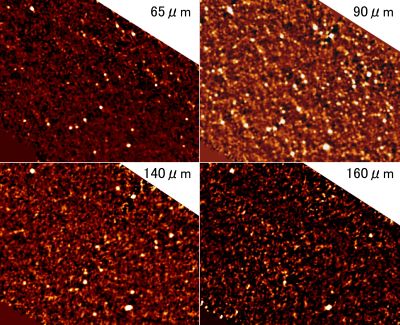
Figure 2: Zoom-in of Figure 1 in four wavelength bands. Each image covers about 1.8x2.3 square degrees. Differences in the brightness of individual galaxies in the different wavelength bands are seen.
The white spots seen in the images are all faint galaxies of different brightness. The faintest spots may be galaxies in the farthest reaches of the Universe. This is the deepest image ever obtained at this wavelength. The results imply that the 'ordinary' galaxies we see at the present time shone very much more brightly in the infrared when they were younger. In many cases this is due to explosive episodes of star birth in their younger years. Examining the images carefully it is evident that some galaxies appear to have a different brightness at different wavelengths than the others. It is suspected that some of these galaxies may be brightened by the energy from a black hole at their cores.
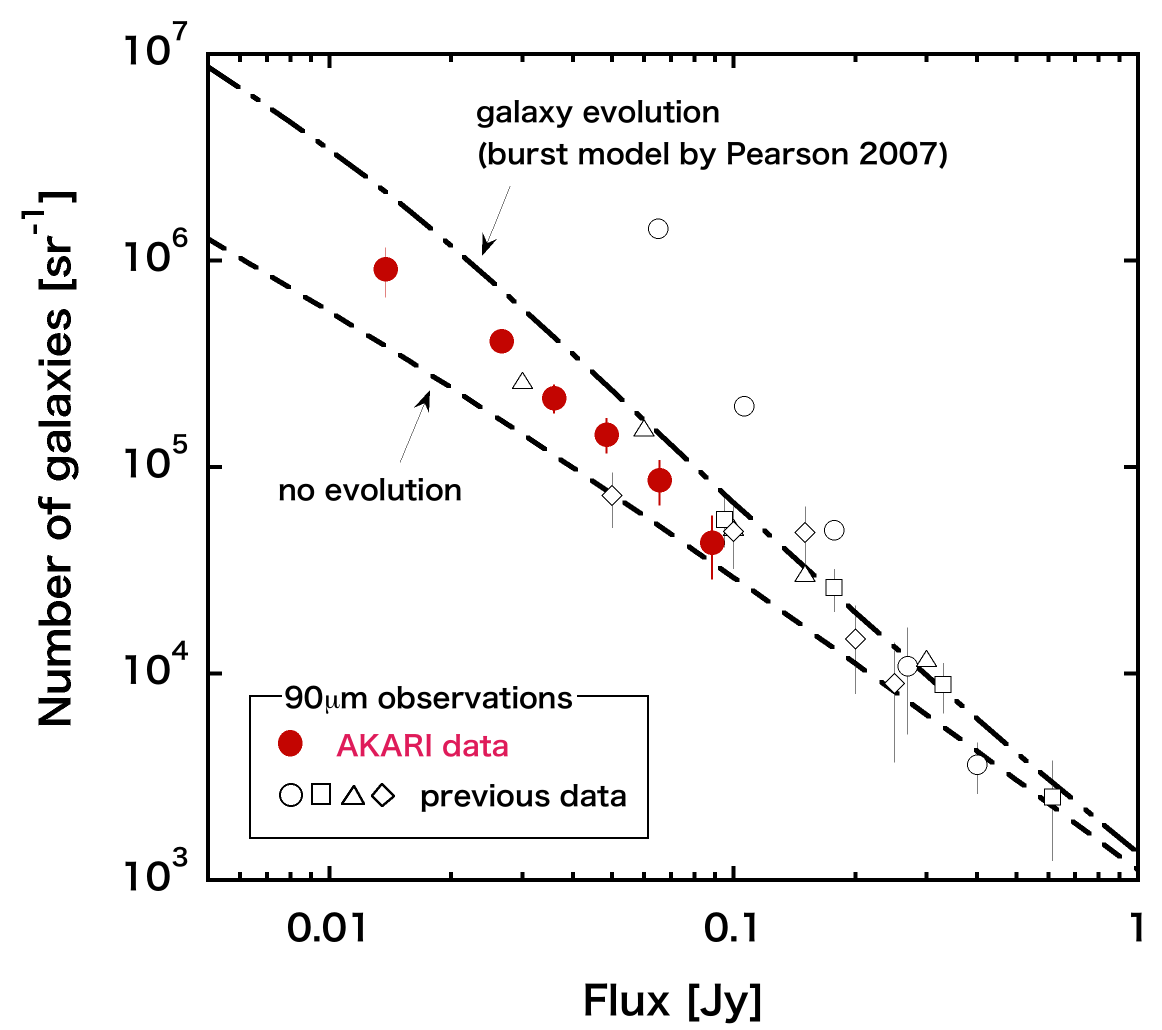
Figure 3 shows a count of the numbers of these galaxies at different brightness in a particularly transparent window through our Milky Way, in another region of the Galaxy, known as the "Lockman Hole". In general, galaxies close to the Earth are bright and are located to the right hand side of the plots where as distant galaxies appear fainter and sit towards the left. If galaxies did not evolve with time, and the intrinsic luminosity and number density of the galaxies were unchanging from the past to the present, the number counts should follow the model line indicated as 'no evolution'. However, AKARI data show that the number of galaxies increases rapidly as they appear fainter. For reference we also plot the results from the ESA's Infrared Space Observatory (ISO) satellite from observations made in the last decade. While the ISO observations show a large scatter in the data points, AKARI, thanks to the progress in observation instruments in the last 10 years, could detected fainter galaxies with observations in different areas of the sky being consistent with each other. The line in the plot denoted as 'galaxy evolution model' is the expected number count assuming that there was significant star formation in the past. This model fits the data obtained by the Spitzer Space Telescope. Our data clearly indicates similar evidence of galaxy evolution but also shows a slightly lower number of galaxies than the model predictions. The Spitzer observations were made at different wavelengths (60 and 160 micrometres) to AKARI and the line in the figure is based on the presently assumed galaxy evolution model. Hence, our new results by AKARI hint at the necessity of a new galaxy evolution model.
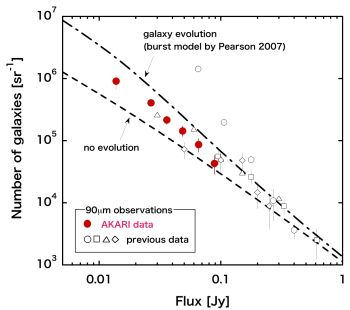
Figure 3: The number count of galaxies of different brightness detected in the "Lockman Hole" region. The plot in fact indicates the total cumulative number of galaxies brighter than a certain brightness. The broken line indicates the number count expected if there is no galaxy evolution. The broken-dotted line shows a model including galaxy evolution. The AKARI data are located between the two lines, implying that the evolution may be milder than previously thought.
The questions of whether such active star formation in the past took place all over the Universe, and how such galaxies look like now, are very important for studies into the evolution and structure of the Universe. The present data being the highest sensitivity with broadest sky coverage ever made, coupled with the large variety in wavelength range will aspire to answer these questions. In addition, note that in Figure 2 the infrared radiation from the regions between the galaxies was also observed. This background structure is due to the sum of the light from extremely faint galaxies not identified with individual objects. Such light is called infrared background radiation and may include radiation emitted from the very beginning of star formation in the Universe. Detailed investigation of these spatial fluctuations in the background and intensity at different wavelengths will reveal the origin of galaxy and structure of the Universe.
Materials
- Figure 1 (© ?)
- Figure 2 (© ?)
- Figure 3 (© ?)